
When Cloud Metrics Lie:Our Journey Running Molecular Simulations on Dataflow
By the Pauling.AI Team
We recently hit a wall that every computational scientist dreads: our cloud monitoring dashboard was telling us we had a problem. GPU utilization for our GROMACS molecular dynamics simulations hovered between 10-20%. Were we hemorrhaging money on idle GPU resources?
Spoiler: the GPUs were fine. The dashboard was misleading, because different tools measure different kinds of “GPU activity.”
The Setup
At Pauling.AI, we run GROMACS, the gold standard for molecular dynamics simulations in drug discovery on Google Cloud Dataflow with NVIDIA L4 GPUs. The value proposition is straightforward: elastically scale computational chemistry workloads without maintaining physical hardware. Run hundreds of simulations in parallel, pay only for what you use.
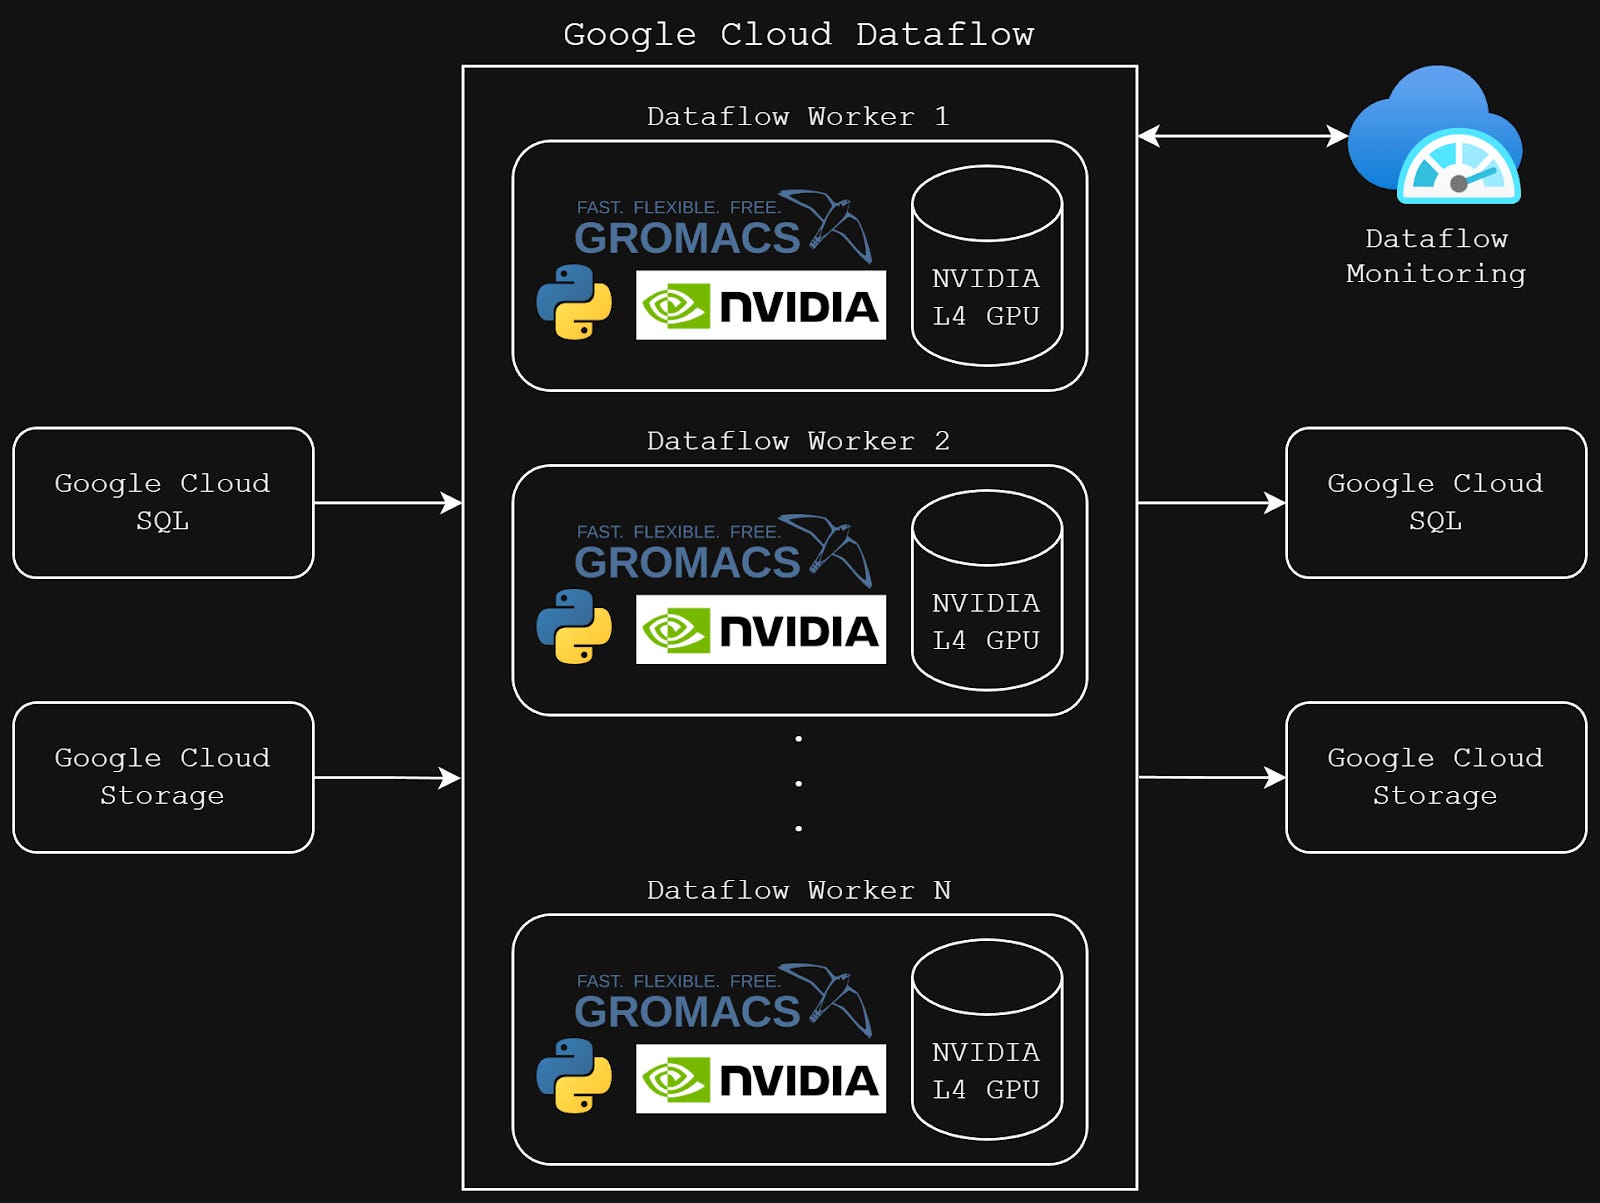
Our GROMACS pipeline architecture on Google Cloud Dataflow with NVIDIA L4 GPU workers
Why molecular dynamics matters: MD simulations are the computational microscope of drug discovery. They let us watch how drug molecules interact with protein targets at the atomic level predicting binding affinity and stability before synthesizing a single compound. For longevity therapeutics targeting complex pathways like cellular senescence and mitochondrial dysfunction, MD simulations validate whether candidate molecules maintain stable binding over biological timescales. Each simulation solves Newton’s equations of motion for millions of atoms at femtosecond timesteps. It’s computationally brutal, which is exactly why GPU acceleration is non-negotiable.
We expected high GPU utilization. GROMACS is GPU-optimized, and our workloads involve intensive force calculations and numerical integrations. When Cloud Monitoring showed 10-20% utilization, alarm bells rang. Were we misconfiguring something? Leaving performance on the table?
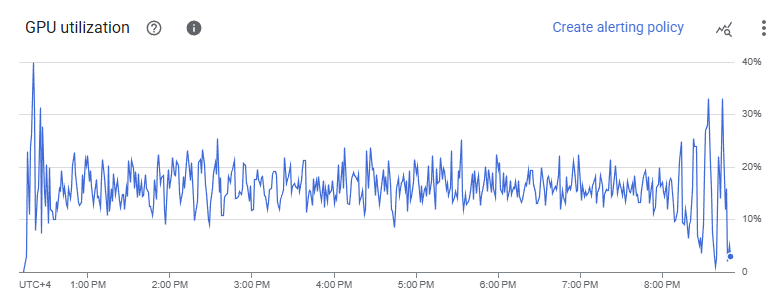
Cloud Monitoring dashboard showing suspiciously low GPU utilization
Down the Rabbit Hole
Our first instinct was to verify the basics. We confirmed GPU access within containers, validated NVIDIA drivers, and tested different CPU core allocations (4, 8, 12, 16 cores). We even enabled NVIDIA Multi-Process Service (MPS) thinking we had a scheduling issue.
Nothing moved the needle.
Then we ran a control experiment: the same GROMACS workload on a standard Compute Engine VM with an identical GPU. The result? 85% GPU utilization according to Cloud Monitoring. Yet both environments Dataflow and VM completed the simulation in virtually identical time.
This made no sense. Same code, same GPU, same performance, different metrics.
We Measured GPU Activity Directly
We stopped trusting the dashboard and went directly to the source. We embedded nvidia-smi polling inside our Dataflow containers to capture GPU metrics in real-time during simulation runs.
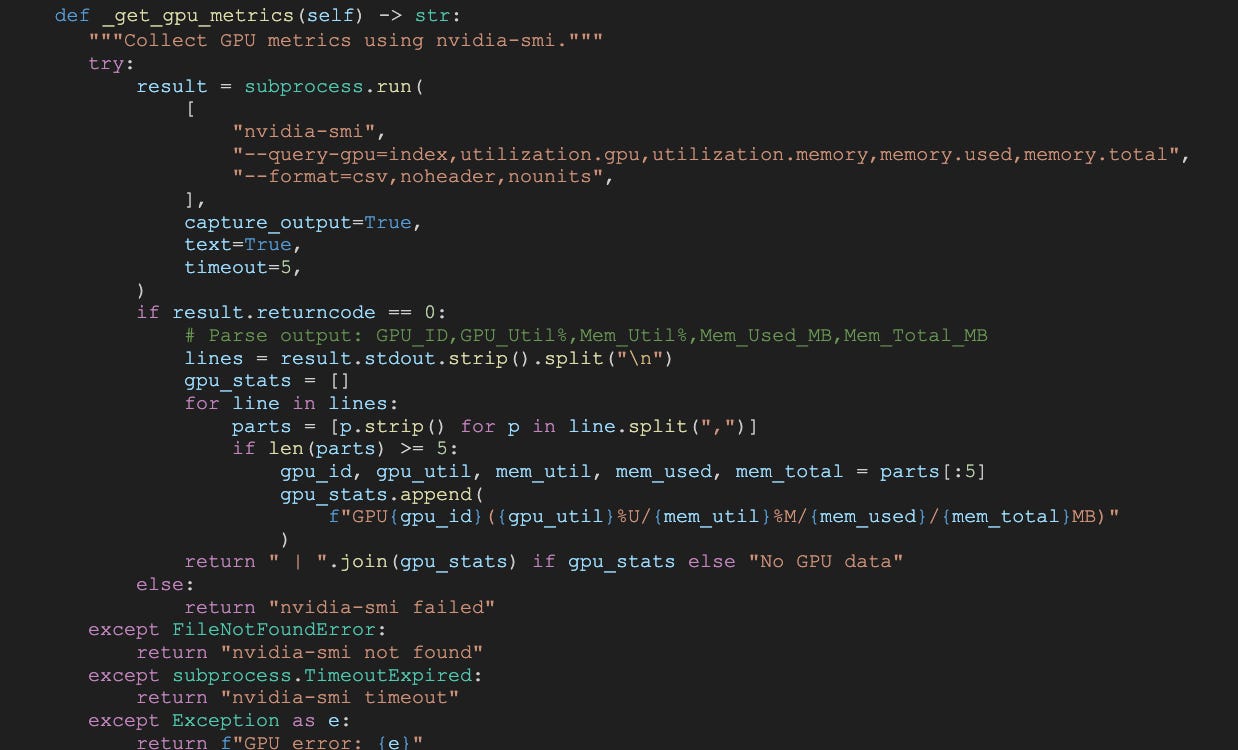
Code snippet - nvidia-smi monitoring script in collapsible section.
The real utilization? 80-90%.
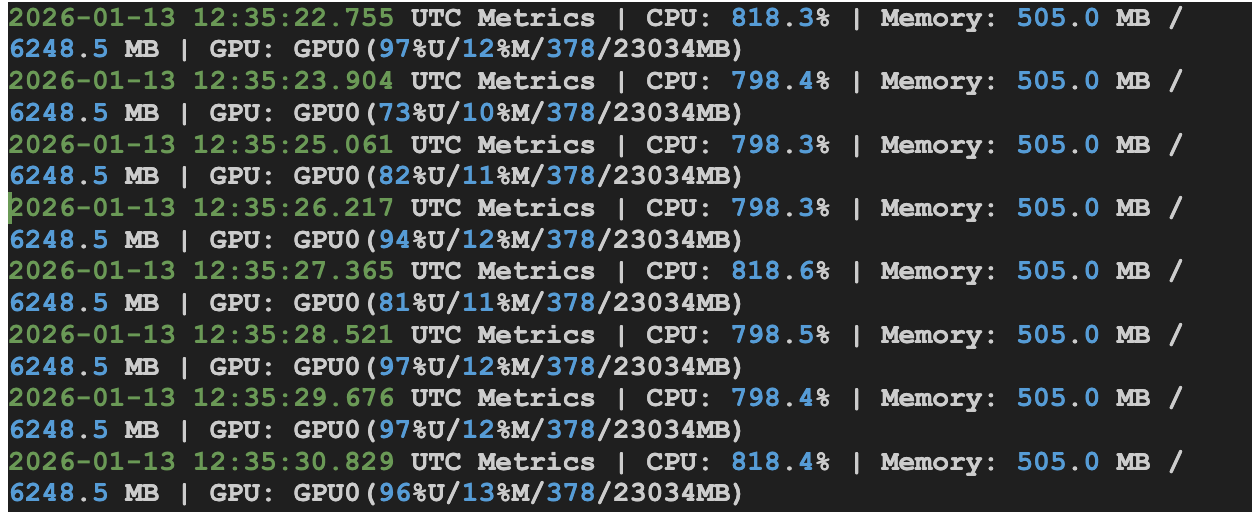
The discrepancy wasn’t a bug, it reflects how different tools define and report “GPU utilization,” and what this workload is actually doing.
In our case, the GROMACS run is memory-bound rather than compute-bound. The GROMACS output showed that 75.6% of the time was spent in “Wait GPU state copy,” meaning the GPU frequently waits on CPU↔GPU memory transfers instead of executing math-heavy kernels.
This is where the dashboards diverge: Cloud Monitoring tends to reflect compute utilization averaged over time windows, which can look low (e.g., 10–20% or 20–40%) when the workload is dominated by transfer/wait phases. Meanwhile, nvidia-smi reports overall GPU activity, including memory-related operations, so it can show 80–90% even when compute cores are not the bottleneck.
Both readings can be technically “correct”, they’re just measuring different aspects of GPU behavior. The real bottleneck isn’t idle hardware; it’s transfer overhead limiting throughput.
Google Confirms It
We escalated to Google’s engineering team, who confirmed the core takeaway: the mismatch is primarily a measurement/definition issue, not a performance regression. In Dataflow, GPU metrics in Cloud Monitoring can under-represent utilization for workloads where GPU time is dominated by memory transfers and orchestration, especially when metrics are sampled and time-aggregated.
The critical insight: there was no meaningful wall-clock penalty. The runtime that matters for throughput and cost was comparable to our VM control.
What We Learned (and What You Should Do)
Don't optimize based on averaged metrics for variable workloads. If you're running scientific simulations, rendering pipelines, or any GPU workload with natural intensity fluctuations, your dashboard might be telling you a story that's statistically true but operationally misleading.
Here's our configuration that actually works:

Code snippet - Key Dataflow configuration flags in collapsible section.

Code snippet - GROMACS mdrun command with GPU flags in collapsible section.
Use --experiments=no_use_multiple_sdk_containers for a single SDK container per worker
Set --number_of_worker_harness_threads=1 as your baseline (tune from there)
Enable NVIDIA MPS only if you genuinely have multiple processes per GPU
Strip out streaming-specific settings for batch pipelines
Performance Over Percentages
Cloud platforms abstract away infrastructure complexity, but they also abstract away transparency. Monitoring systems optimize for general use cases, not specialized scientific workloads. When metrics don’t align with your understanding of the workload, trust your domain knowledge and validate directly.
We nearly spent days “optimizing” a problem that didn’t exist.
The real optimization opportunity? Understanding the measurement tools as deeply as we understand the computational methods.
If you’re running molecular simulations, quantum chemistry calculations, or any computationally intensive scientific workload in the cloud, remember:
performance is measured in seconds per simulation, not in dashboard percentages.
The GPUs don’t care about how a dashboard aggregates metrics. What matters is whether your workload is compute-bound or memory-bound and whether your monitoring tool is measuring compute, transfers, or a blend of both.
Our GPUs were busy all along, but the dashboard wasn’t telling the full story.
If you are interested in automation of drug discovery, reach out!